Know if you can win before you waste a call
Win Likelihood scores every account against 70M+ historical deal outcomes to give your team a real probability of winning - by scenario, competitor, and deal size.
The Problem
Reps can not tell a winnable deal from a waste of time
Without historical benchmarking, every deal looks the same. Reps optimise for pipeline volume instead of win probability - and quota attainment suffers.
Win-loss reviews happen months after the damage is done
Post-mortem analysis tells you why you lost last quarter. It does not tell you which active deals have a 20% chance of closing - before you invest three more months of effort.
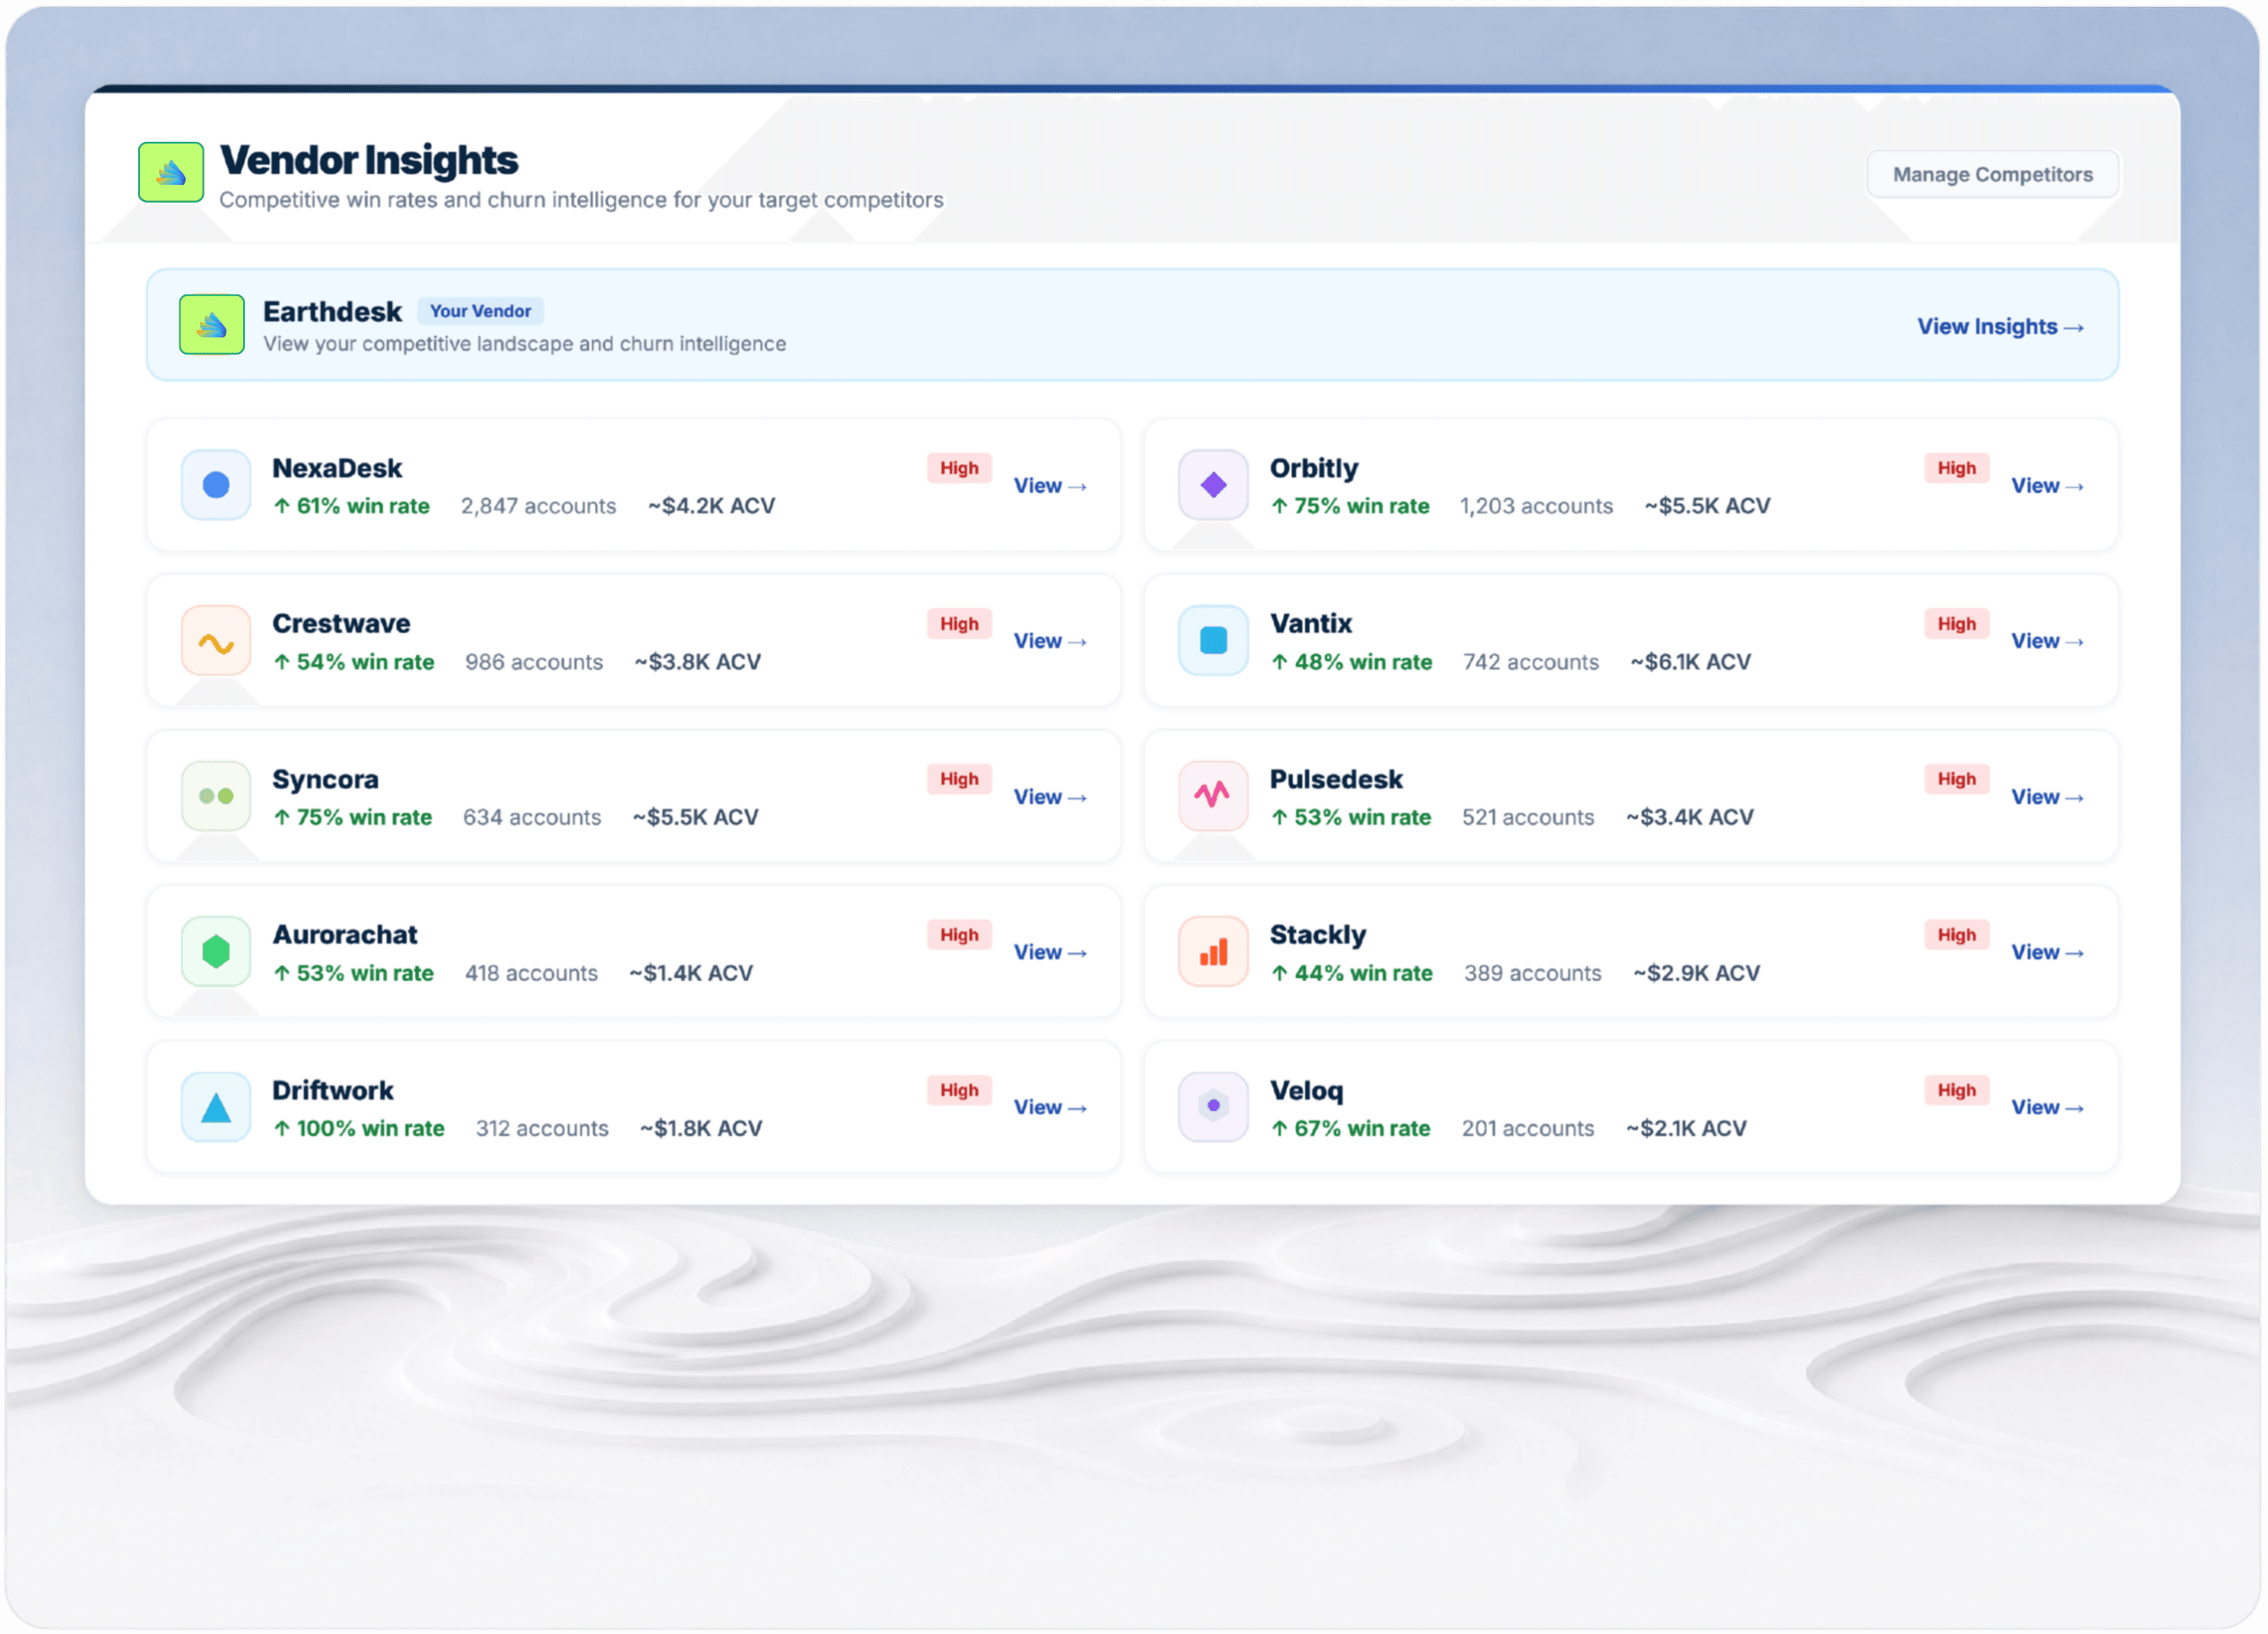
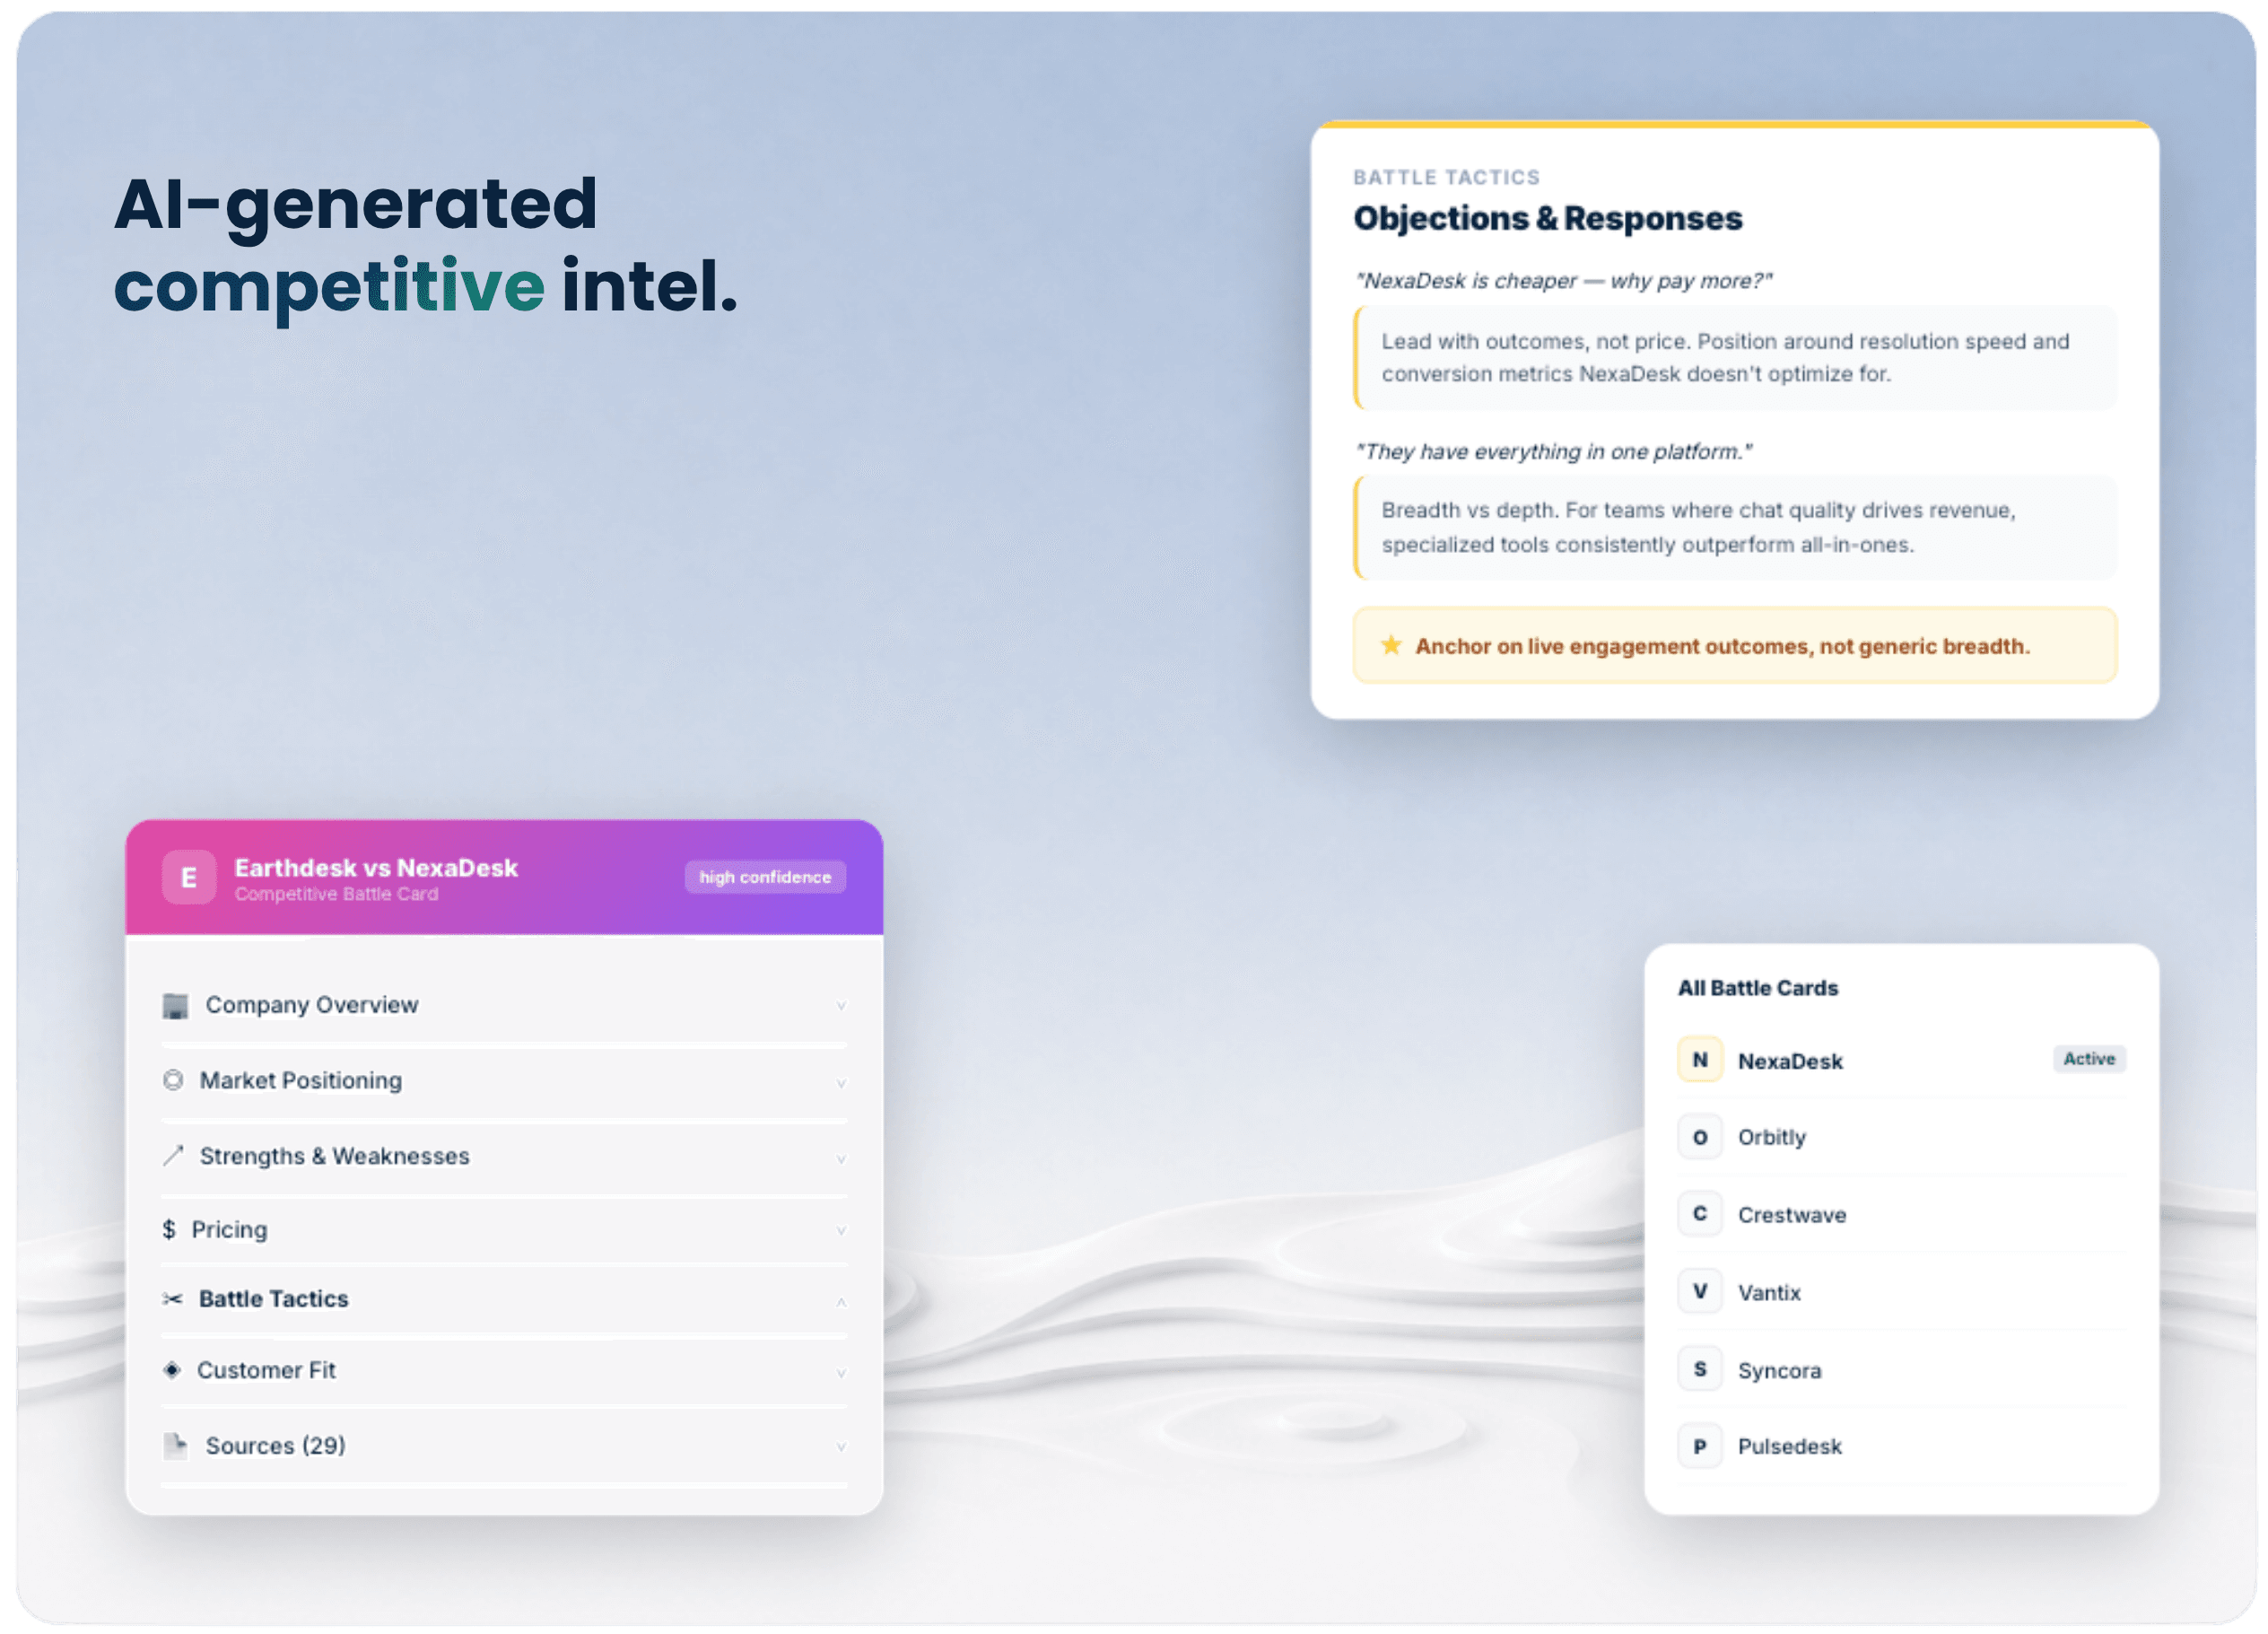
Competing blind against vendors you do not recognise
You discover who the incumbent is on the first call. By then, the evaluation is half over. Knowing the competitive landscape before outreach changes everything.
Probability built from real outcomes
Not a model trained on your own win-loss data - a score built from every deal the market has ever seen.
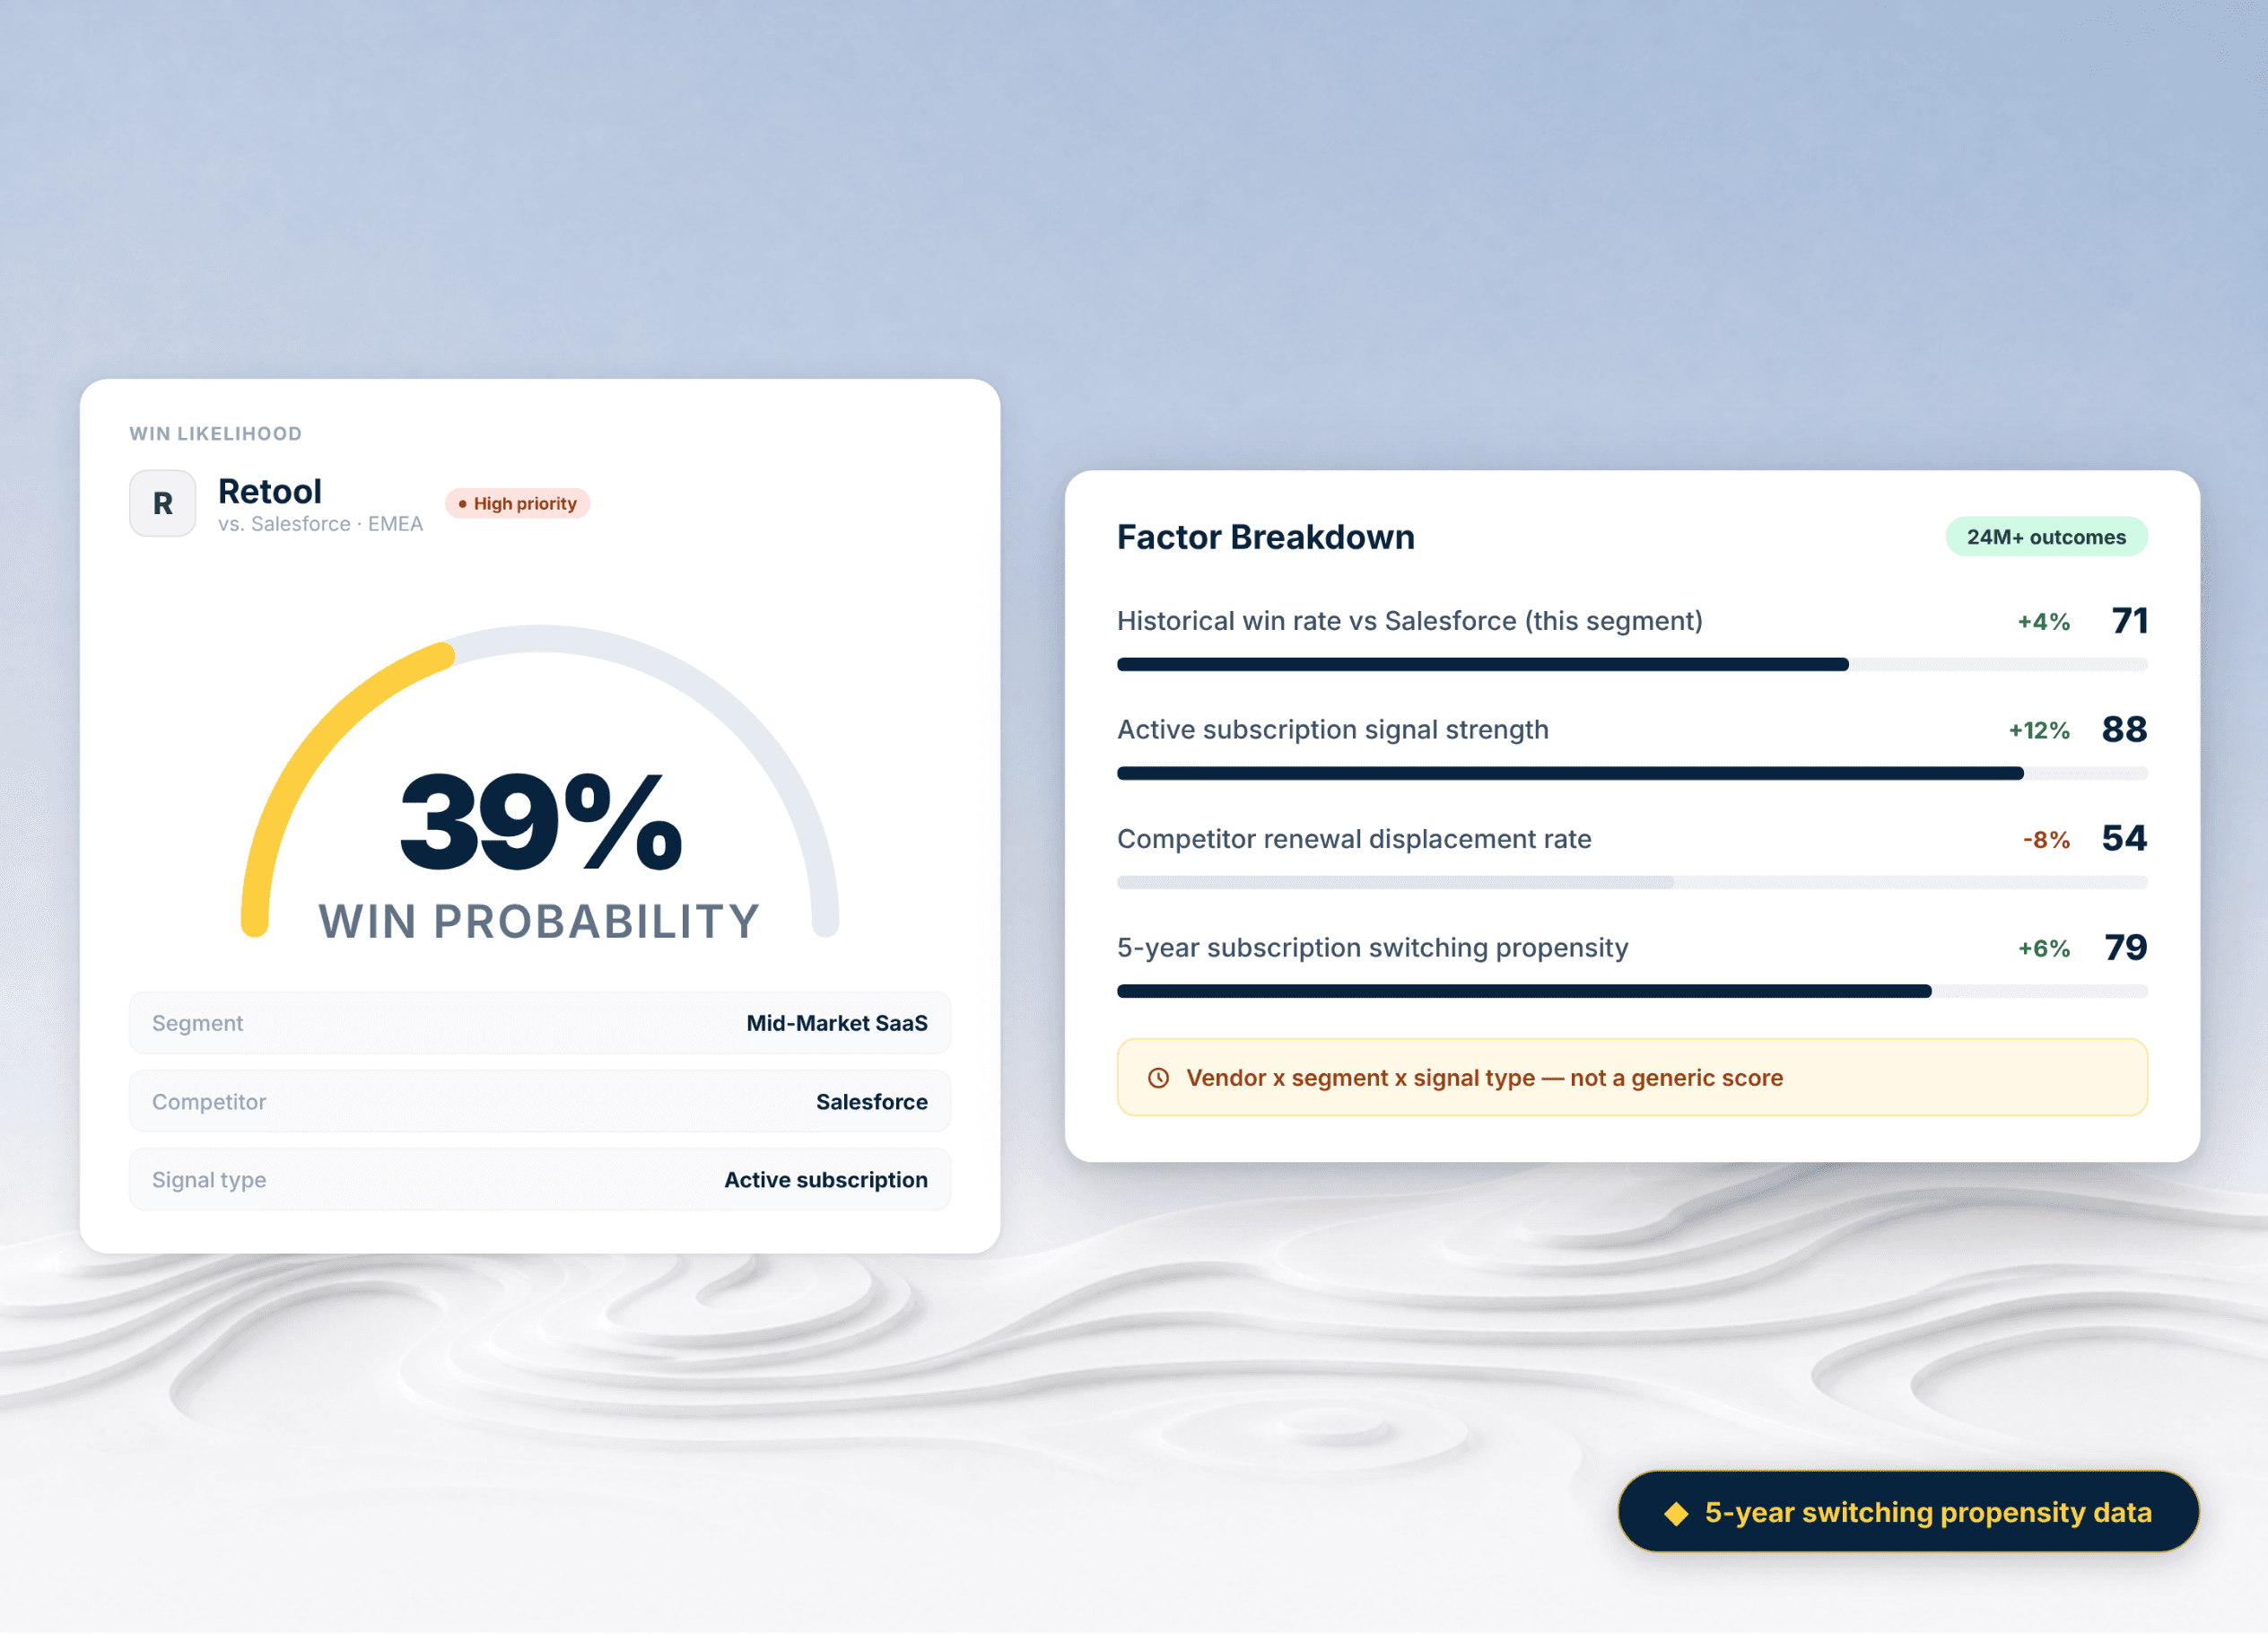
A win probability for every account in your market
Win Likelihood uses 70M+ historical deal outcomes to calculate the probability of winning each account - before your first touchpoint. Scores factor in vendor context, deal size, company stage, and your historical performance in similar scenarios.
- Win probability score on every account in your addressable market
- Benchmarked against 70M+ historical deal outcomes across all verticals
- Updated daily as evaluation signals and competitive context change
Not just overall odds - win rates by specific scenario
Win Likelihood breaks down probability by competitive scenario. Your odds when displacing Salesforce are different from displacing HubSpot. Your odds in enterprise differ from mid-market. Scores reflect reality, not averages.
- Scenario-specific win rates by incumbent vendor and deal type
- Segment-level benchmarking across company size, industry, and region
- Confidence banding so reps know how much to rely on each score
Prioritise your pipeline by probability, not just size
Sort and filter your entire pipeline by Win Likelihood score. Identify which deals deserve investment and which need a different approach - so your best reps spend time where the probability is highest.
- Pipeline view sorted by composite Win Likelihood score
- Deal-level flags for low-probability accounts currently in late-stage
- CRM sync so probability data lives where your reps already work
Win Likelihood feeds the Opportunity Score
Win Likelihood is one of three signals powering the composite Opportunity Score. Combined with ICP fit and purchase intent, it tells your team not just who is buying - but whether you can win.
See how the Opportunity Score worksWin Likelihood - frequently asked questions
Win Likelihood scores every account in your addressable market with a real probability of winning before your first touchpoint. Scores factor in vendor context, deal size, company stage, and historical performance in similar scenarios so reps prioritise by probability, not just pipeline volume.
Find out who's evaluating in your market right now
before your competitors do.
30 minutes. No commitment. We'll show you the accounts actively evaluating in your market today.
No credit card · Tailored to your ICP · Live data, not a slide deck